Introduction
Cryptocurrency is a digital currency that is secured by cryptography that will deter the possibility of counterfeiting the currency. There are several types of cryptocurrencies and most of them are decentralized networks based on blockchain technology. The most prominent feature about a digital currency is that these currencies are generally not issued by any central authority.
According to Yahoo Finance, as of 6th March 2022, the market cap of the top 30 cryptocurrencies is $1.612T. The market volume of top 30 crypto within 24 hours was $84.39B, making a 35.64% decrease compared to the day before. The cryptocurrency market is highly volatile, and is deemed so risky that the Monetary Authority of Singapore has issued guidelines to curb cryptocurrency trading being promoted to the public. Nonetheless, trading is still legal and there is ever-growing interest among investors. Hence, there is a need for users to discover and visualise the volatility of the market, identify seasonality and predict future trends so that they can make a more informed decision on their investment.
Motivation and Objectives
The main motivation of this project is the lack of interactive web-enabled visualisations to compare and allow users to easily identify generalised patterns of multiple crypto currencies in a single dashboard. The analyses that are available to the public are usually those comparing the few common crypto currencies, in fact many focussed on bitcoin only since it’s the most well known one. However, there are currently over 9,000 crypto currencies in the market.
The project aims to provide a web-enabled application for users to visualise real-time trends and perform analysis of cryptocurrencies in an interactive and user-friendly manner. The specific objectives are:
- To effectively visualise the general price movement patterns of the major cryptocurrencies (by market cap) and diagnose anomalies based on the selected time periods.
- To enable users to conduct detailed analysis on the seasonal patterns, cycles and remainder component, as well as autocorrelation (ACF and ACF).
- To predict selected cryptocurrencies using classical forecast algorithms like Arima, andrecently developed machine learning algorithm like Prophet.
Users will be able to use a single application/dashboard to visualise the overall market trends, identify seasonal patterns and determine if the patterns are similar for other cryptocurrencies, beyond bitcoin. Prospective investors can also use the application to predict the price movements of cryptocurrencies based on classic time series forecasting algorithms, and recently-developed machine learning algorithms.
Data Description
The main dataset will contain the top 30 cryptocurrencies as of 16 March 2022, based on Yahoo Finance’s Top Cryptos by Market cap). Real time dataset will be scripted from Yahoo Finance with a minimum of two years of historical data.
Methodology
To develop the dashboard, we plan to carry out the following steps:
Data wrangling and transformation: The scripted dataset need to be tidied into format that can be read by the R packages used e.g. using daily prices, converting the data into tibble format that is ideal for time series analysis.
Exploratory and Seasonal analysis: Using suitable graphical and time series decomposition methods to reveal the seasonal patterns
Predictive analysis: Modelling the time series using various forecasting algorithms and predict future prices.
Interactive dashboard: Develop and publish an interactive dashboard containing the above components.
Storyboard
The dashboard will be split into 3 sections, where users will be recommended to go through the sections sequentially.
Exploratory
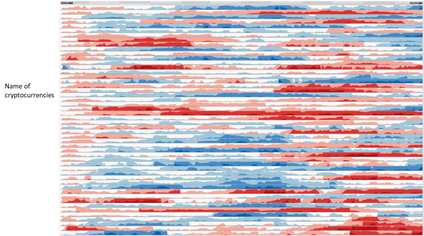
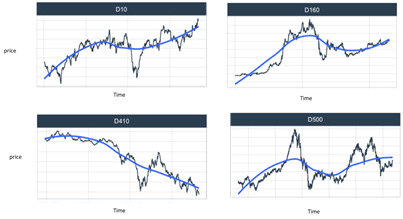
The first section, “Exploratory” will provide an overview on the price fluctuations of the major cryptocurrencies using horizon graph. Next users can zoom into the selected cryptocurrencies with more positive trends, using simple time series charts to have a closer look on the trends of the selected crytocurrencies and visualise anomalies. Users can use the findings from this stage to identify suitable cryptocurrencies (e.g those with seasonal patterns, or those with ) for further analysis in the next section.
Seasonal and Correlation
With the observations gleaned from the first section and having identified the cryptocurrencies of interest, users will use the “Seasonal and Correlation” section next. In this section, users can can achieve deeper understanding and identify seasonality patterns of different time intervals with time series decomposition method (STL), and understand whether the time series has any trend or white noises using auto-correlation (ACF and PACF) charts.
Prediction
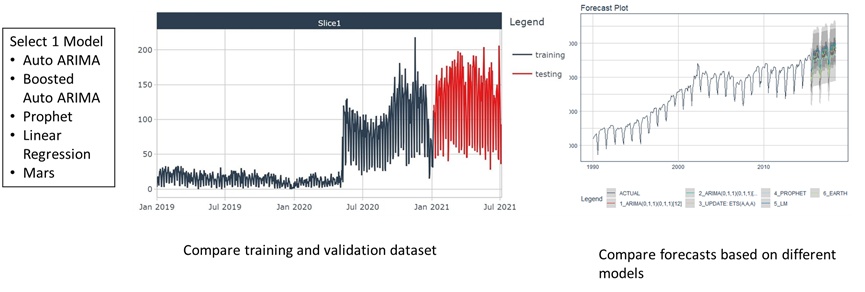
In the third and last section, users will be able to predict future prices of selected cryptocurrencies using classic time series forecasting methods like Arima and newer machine learning algorithms like prophet, and compare the performance of these methods.
Some of the proposed visualsiation methods described in the earlier paragraphs are shown below.
- Horizon graph: This is to show the historical prices of many crypto currencies in one visualisation, as a quick way to identify similar patterns across the currencies.
- Time-series plot (faceted): This is to compare the time series pattern of selected crypto currencies.
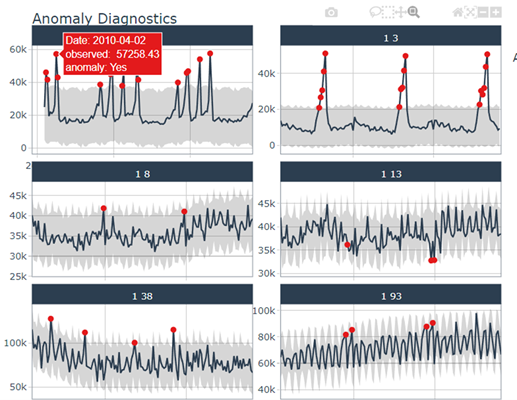
- Anomaly diagnostics: This is to detect and visualise anomalies which can signify special events, and to identify anomalies for cleaning to improve forecast error.
- Forecast modelling: This is to apply suitable time series models to predict the prices of crypto currencies, and to compare the results of the various forecast models quickly. From this, investors could predict their potential rate of returns.
R packages
The software used for this project is R, and the R packages that are going to be applied for the dashboard application are:
| Packages | Purpose |
|---|---|
| Shiny and Shiny dashboard | To build interactive web application and visualisations |
| rsconnect | To publish the dashboard on shinyapps.io |
| Tidyverse | To tidy up and manipulate the data |
| Plotly | To create interactive graphs |
| ggplot2 | To create static graphs |
| modeltime | To build time series forecast models using various methods such as classical methods(ARIMA), new methods (Prophet) and machine learning (Tidymodels) |
| ggHoriPlot | To build horizon plots in ggplot2 |
| tidyquant | To script cryptocurrency data for time series analysis from Yahoo Finance and to re-format the dataset into dataframe or tidyverse format |
| timetk | To create interactive visualization, tidy time series data wrangling and preprocess time series data |
| shinythemes and bslib | To beautify the dashboard with suitable themes |
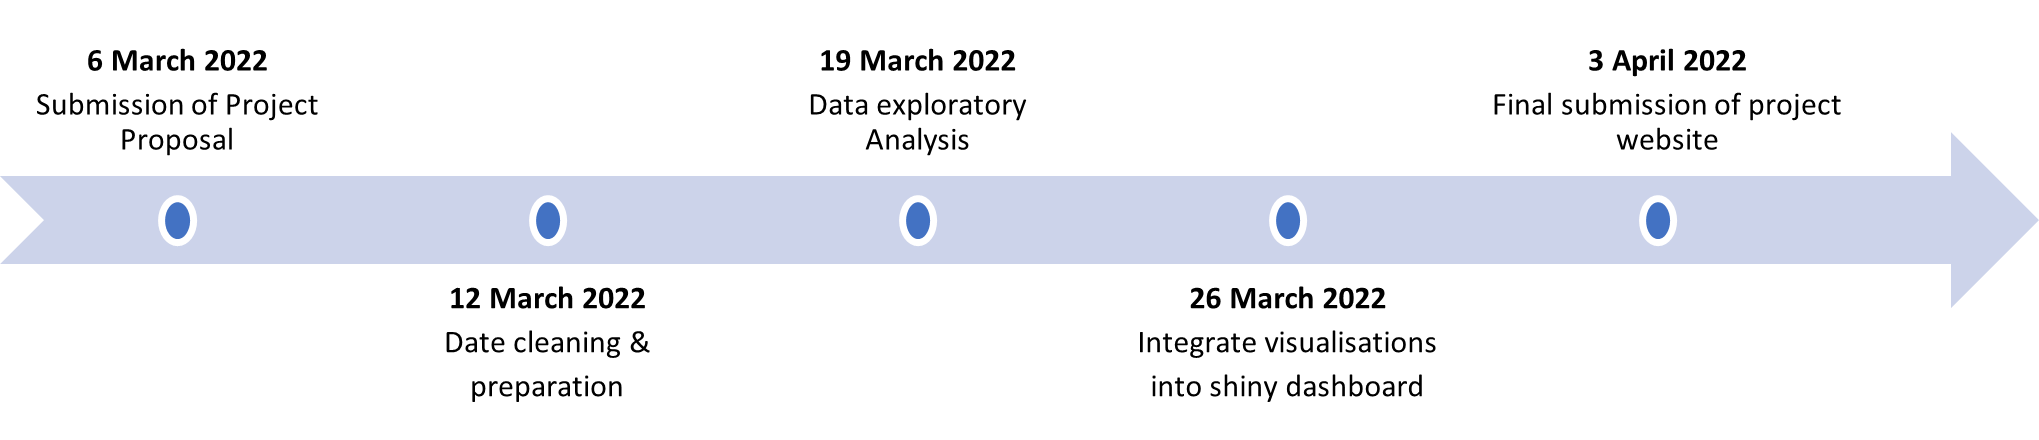
Project Milestones
References
- Cryptocurrencies
- Factors Influencing Cryptocurrency Prices
- Model Time
- Plotting Time Series
- Anomly Detection
- Quant Mod
- Crypto Prices Move More In Sync With Stocks
- Crypto Trading, Straits Times
- Top Crpyto By Market Cap
- Forecasting Principles and Practice